The generic statement 'ceramic is faster than steel' is not always true.
The difference in frictional losses between the top performing ceramic sample and the top performing steel sample is 0.03 watts. Three manufacturers’ steel models outperformed their ceramic model counterpart.
Bottom Bracket efficiency is based on the design and the quality of materials, not necessarily on the type materials (i.e., ceramic vs. steel).
When analyzing the individual components that contribute to the total frictional losses of a bottom bracket, the frictional losses due to the seals and lubricant is greater than the frictional losses due to the bearings themselves (ball/race interaction friction).
Losses from Seals & Lubricant > Losses from Bearings
Independent Bottom Bracket Efficiency Study
Conducted by Friction Facts
35 Bottom Brackets of various manufacturers and types were analyzed for efficiency (frictional losses) under different loading conditions.
Procedure Overview
A cyclist is rarely in a purely vertical orientation with respect to the ground. Basic pedaling mechanics put the bike in an off-vertical orientation with every pedal stroke. Heavy acceleration and climbing can increase the off-vertical angle substantially. Any off-vertical orientation creates a component of lateral loading at the bottom bracket. As a result, the bottom bracket samples were tested with lateral loads, in addition to pure radial loads.
Loading Methods, Bottom Bracket Types, and Material:
The loading conditions consisted of 114 lbs pure radial loading and a combination of 114 lbs radial with 20 lbs lateral loading applied to each left and right sides. The Bottom Brackets were also analyzed for efficiency under no-load conditions. The samples consisted of three types of bottom brackets – Standard Threaded, PF30, and BB30. Both steel and ceramic-hybrid samples were tested. See the “Full Procedure” section for additional details.
Loading Conditions:
- 114 lbs Pure Radial
- 114 lbs Radial & 20 lbs Lateral Right Simultaneously
- 114 lbs Radial & 20 lbs Lateral Left Simultaneously
- Unloaded
Bottom Bracket Type (Referred to as a Standard):
Bottom Bracket Bearing Material
- Steel
- Ceramic
NOTE: The “ceramic” bearings tested are actually a ceramic-hybrid design. Ceramic-hybrid bearings typically utilize ceramic ball bearings and steel or steel-alloy races. The use of the term “ceramic” in this report refers to the ceramic-hybrid design, not a full-ceramic design.
Determining AVERAGE Friction:
To determine the average frictional losses for each bottom bracket, 80% of the pure radial measurement, 10% radial/left lateral measurement, and 10% radial/right lateral measurement were combined. The calculation provides a weighted average.
Results
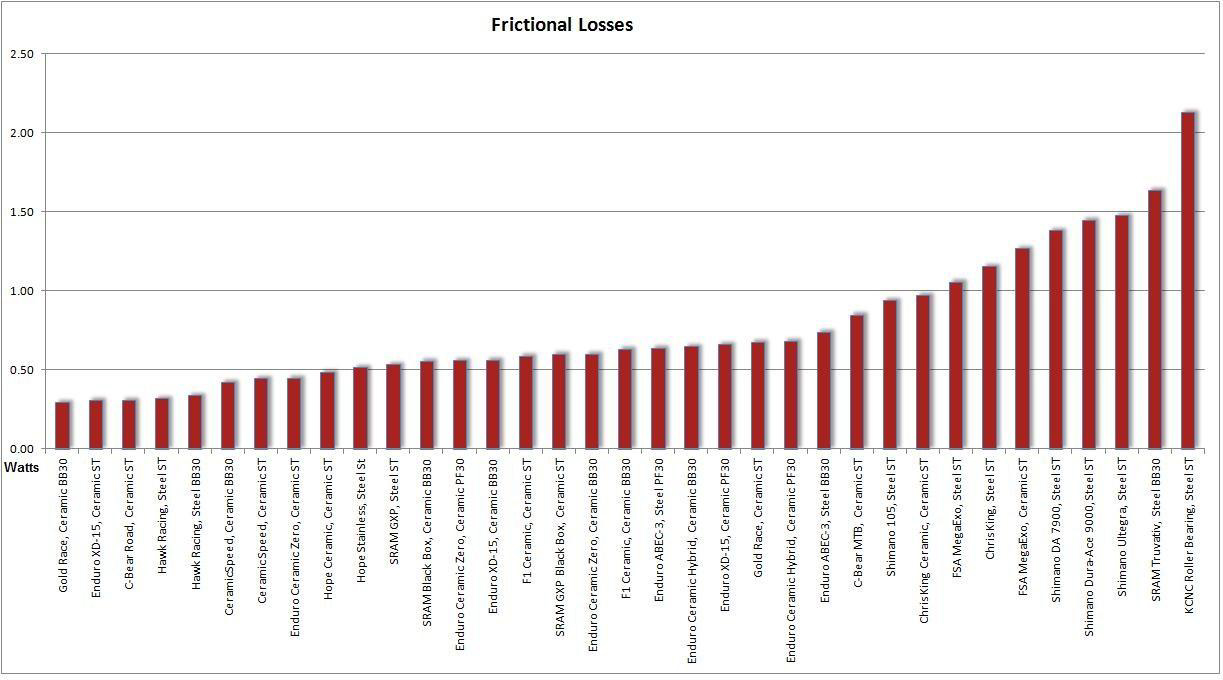
Comparing Bottom Brackets; Average Frictional Losses:
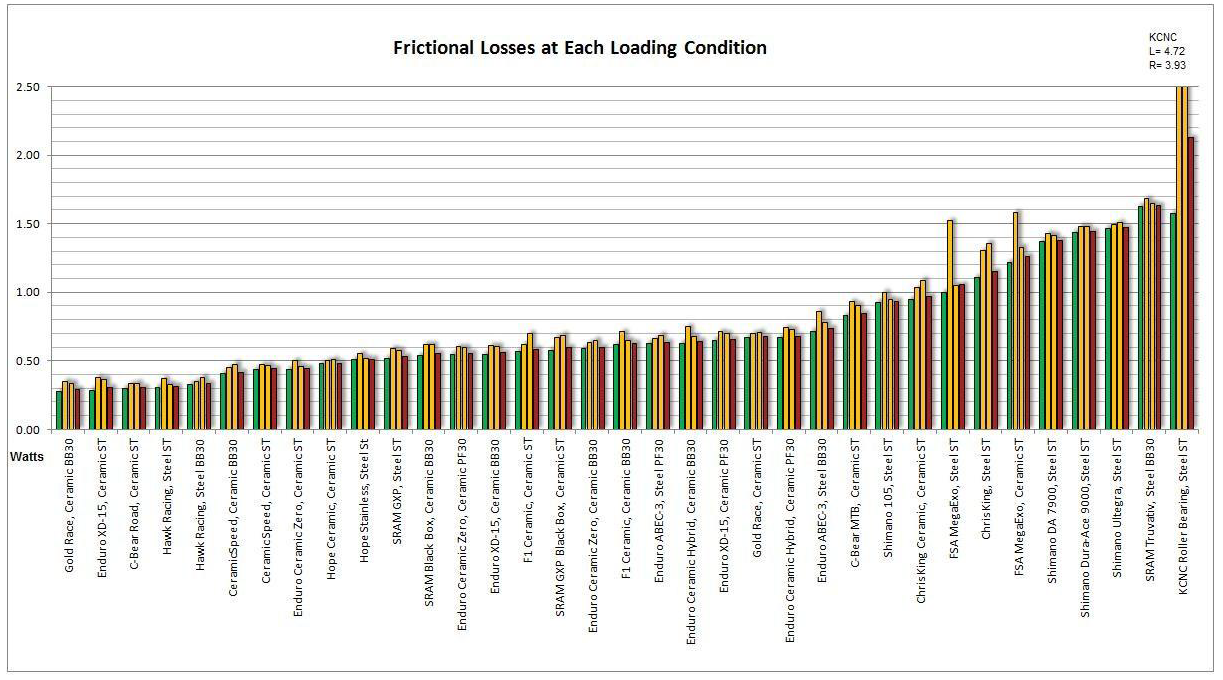
The graph above displays the average frictional losses of each sample under loaded conditions. The frictional losses shown (watts) are a weighted average of the three loaded testing conditions. The bottom brackets are labeled with the bearing model, the bearing material, and the bottom bracket standard.
The Bottom Line:
Friction losses of the bottom brackets under loaded conditions ranged from a low value of 0.29 watts (Gold Race, Ceramic BB30), to a high value of 2.13 watts (KCNC Roller Bearing, Steel ST), with an average of 0.77 watts, and a median of 0.63 watts.
Comparing Load Contributions to Average Frictional Losses:
The Frictional losses measured for each of the three loading conditions, including the weighted average, are broken out in the graph above.
- The green bars are pure radial loading measurements.
- The yellow bars are the radial/lateral loading measurements, left side and right side respectively.
- The red bars are the weighted averages.
The Bottom Line:
For bottom bracket applications, radial deep-groove bearings and angular-contact bearings both perform well in each of the three loading conditions. Neither type of bearing is at a disadvantage relative to each other with regard to the specific type of load.
Comparing Bearing Materials:
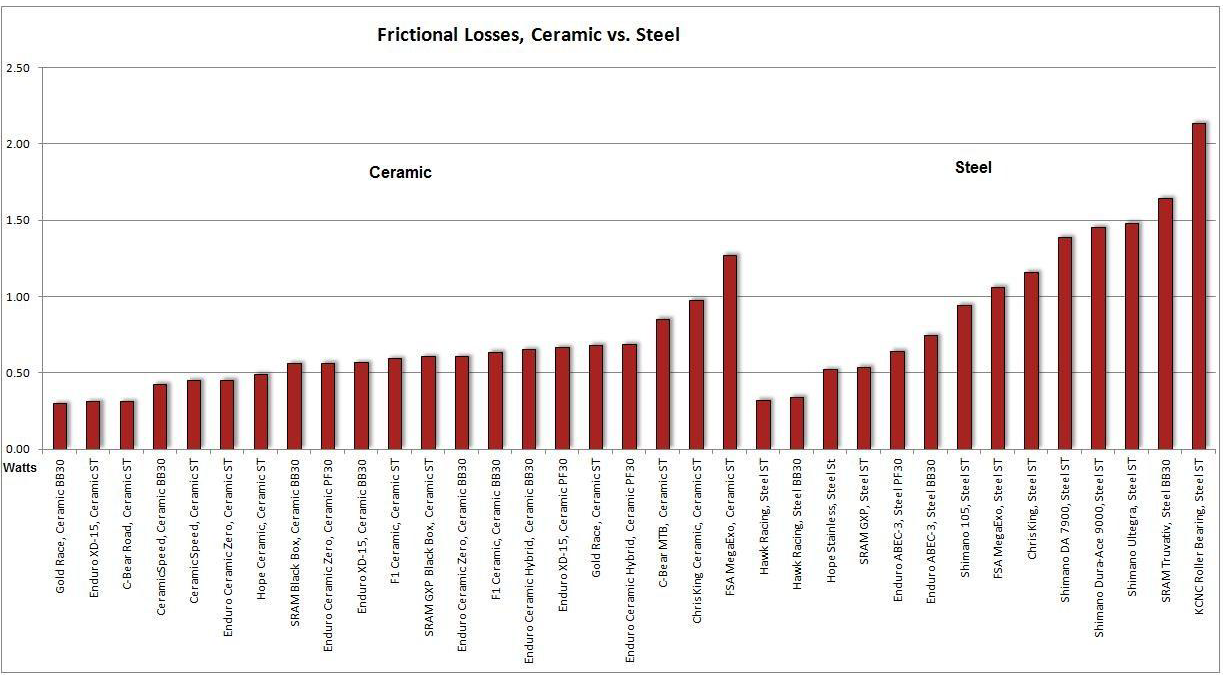
A variety of ceramic and steel bottom brackets were chosen to analyze the efficiency differences, if any, between these two materials. The graph above displays the average frictional losses broken out by bearing material type.
Comprehensive Results:
The average frictional losses of the ceramic bottom brackets is 0.60 watts, while the average frictional losses of the steel bottom brackets is 1.02 watts.
This difference between the Ceramic and Steel, with no further explanation, can lead to a quick, but inaccurate, conclusion that ceramic bearings generally exhibit less friction than steel bearings. Of the 35 samples tested, many were higher-end ceramic while others, lower-end steel. When the frictional losses of the top performing ceramic sample and top performing steel samples are compared (Gold Race at 0.29 watts and Hawk Racing at 0.32 watts), the difference is 0.03 watts. This illustrates that certain steelbearing bottom brackets perform as efficiently as the best ceramic-bearing bearing bottom brackets (within 3/100 of a watt). Thus, ceramic-bearing bottom bracket are not necessarily more efficient than steelbearing bottom brackets, based on bearing material alone. Bottom Bracket efficiency is predominantly based on the design and the quality of materials used, not the material itself.
The Bottom Line:
The generic statement ‘Ceramic is faster than steel’ is not always true
A 0.03 Watt difference between the top performing ceramic and steel bearings
Gold Race BB30 Ceramic
0.29 Watts Frictional Loss
Hawk Racing Standard Threaded Steel
0.32 Watts Frictional Loss
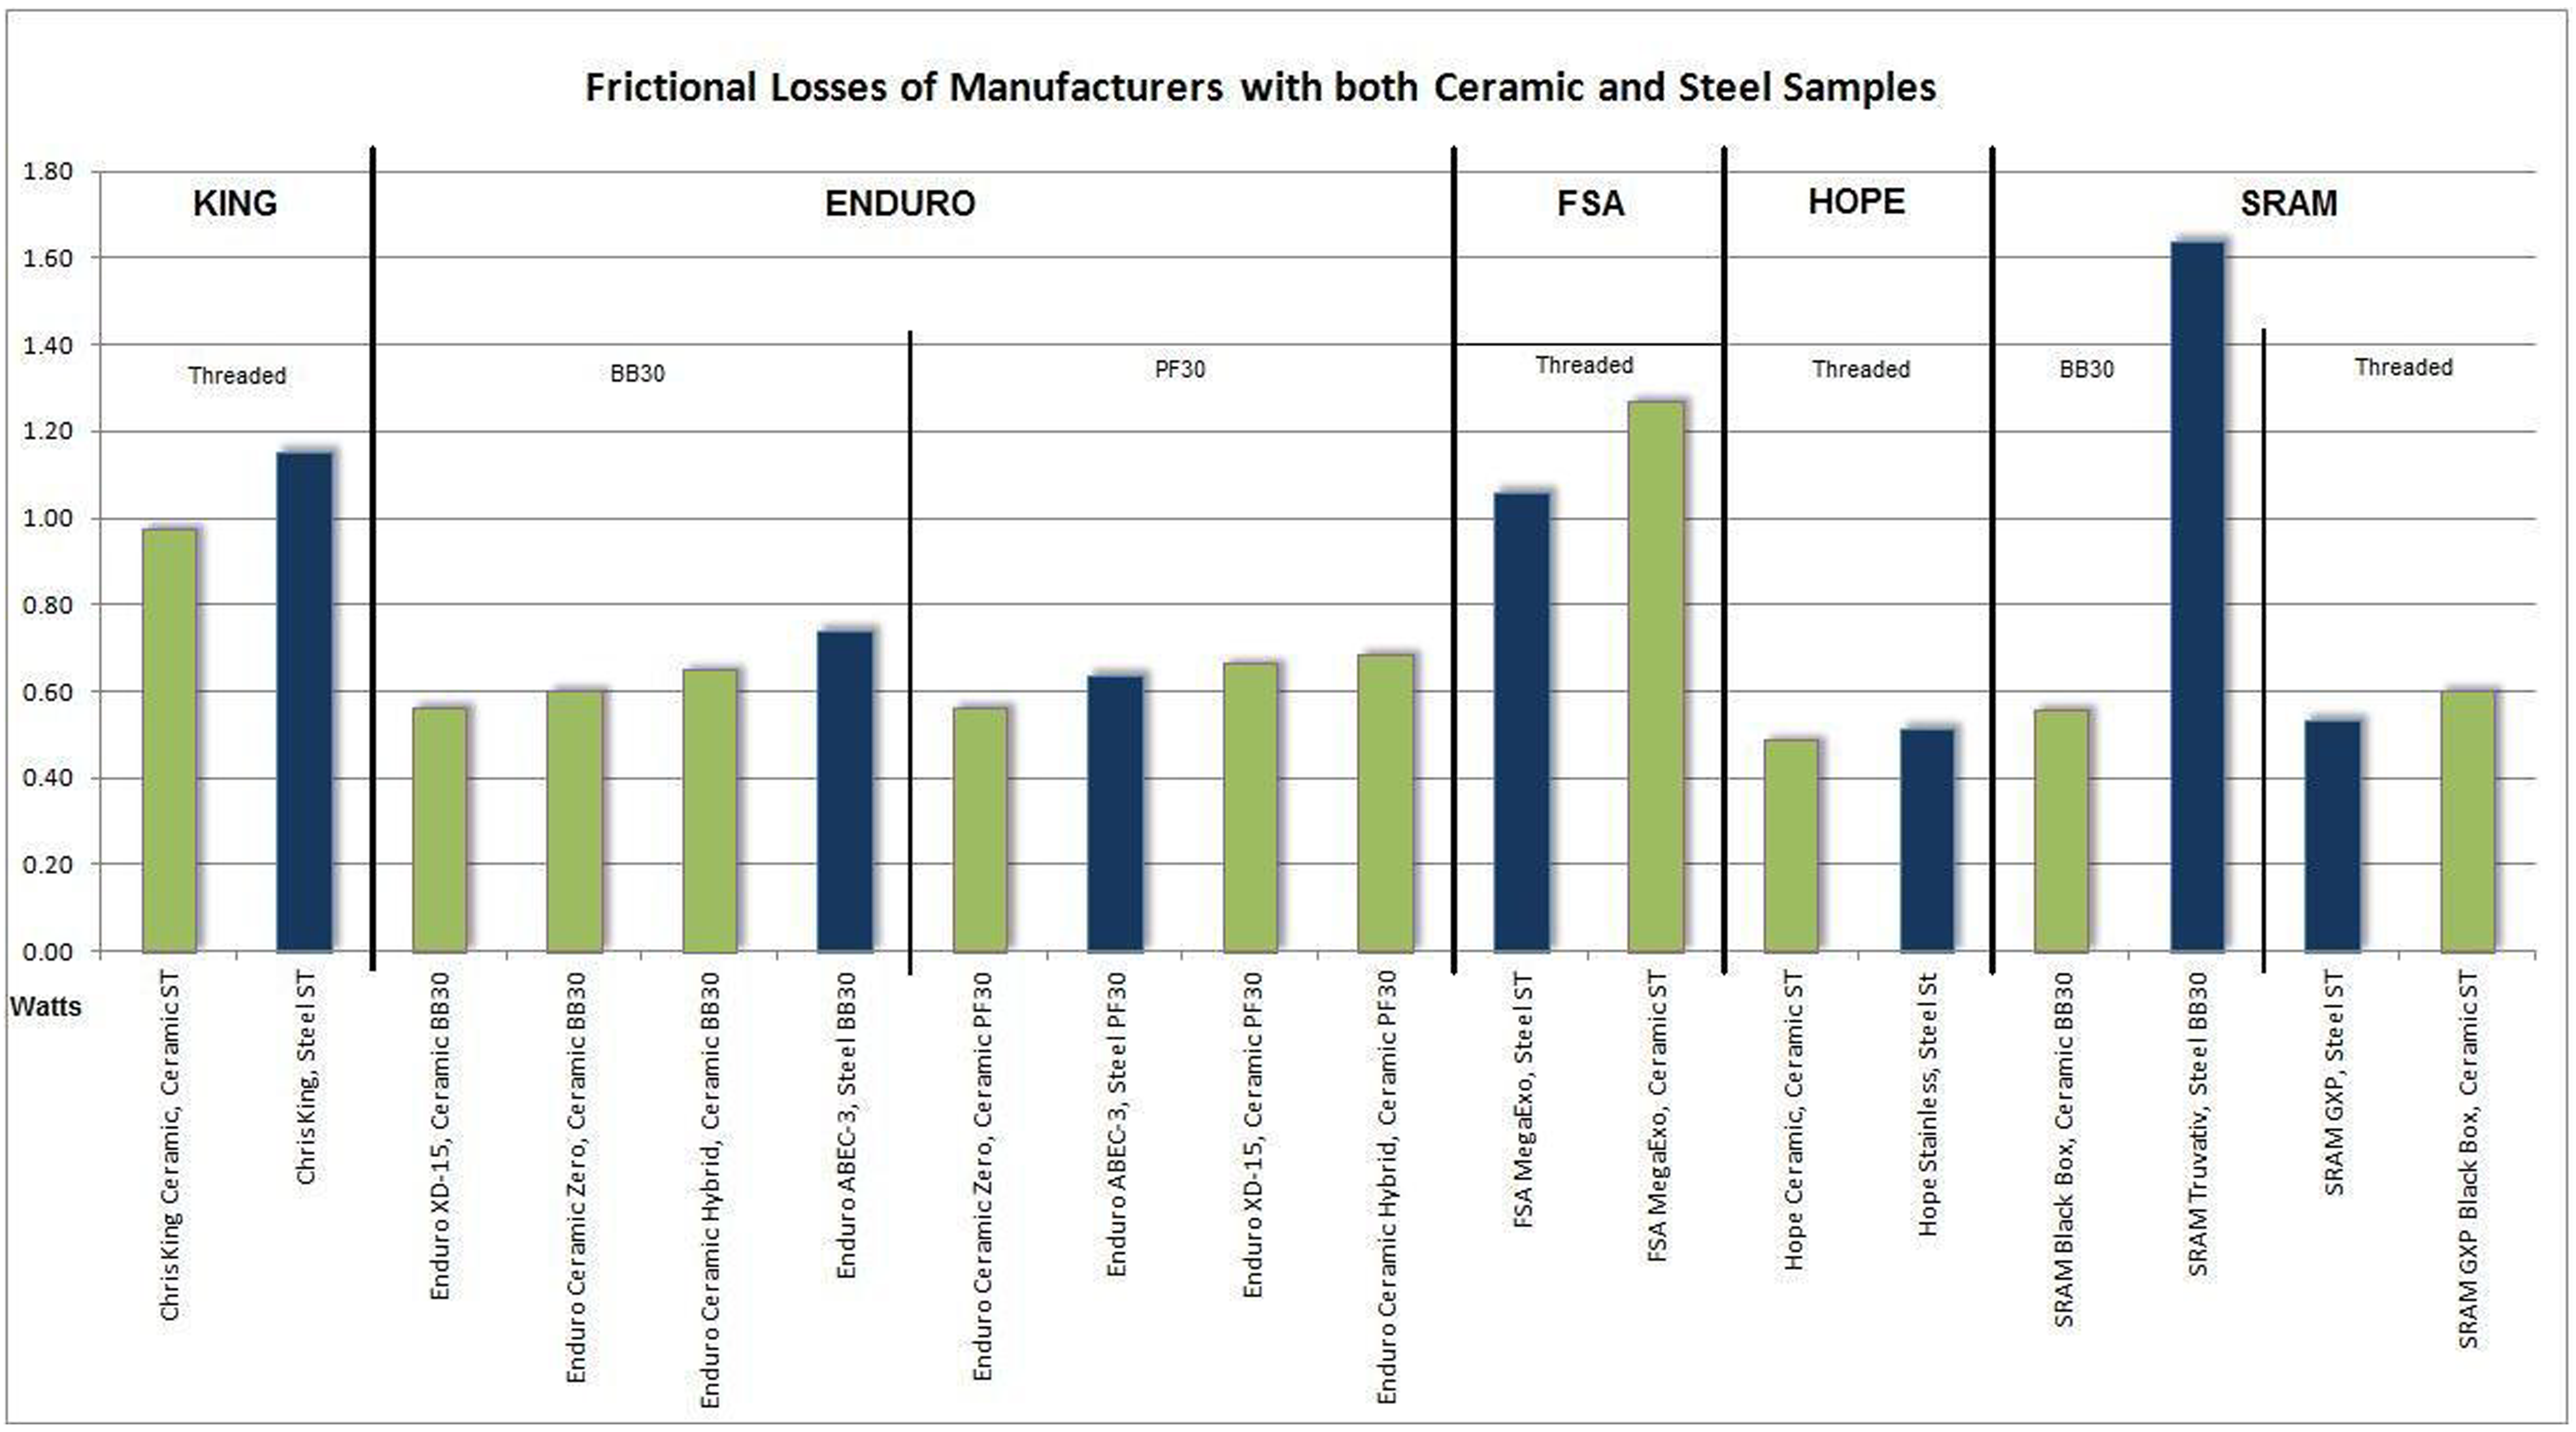
Comparing Ceramic vs Steel (Within a Manufacturer):
Frictional Losses of manufacturers with both ceramic and steel models, comparing the same standards.
Comprehensive Results:
Of the five manufacturers with both ceramic and steel bottom brackets included in this test, three of the five of the manufacturers’ ceramic products exhibited higher frictional losses than their steel counterparts within the same standard.
The Bottom Line:
The quality of design and quality of materials of a bottom bracket should be considered, not just the material itself.
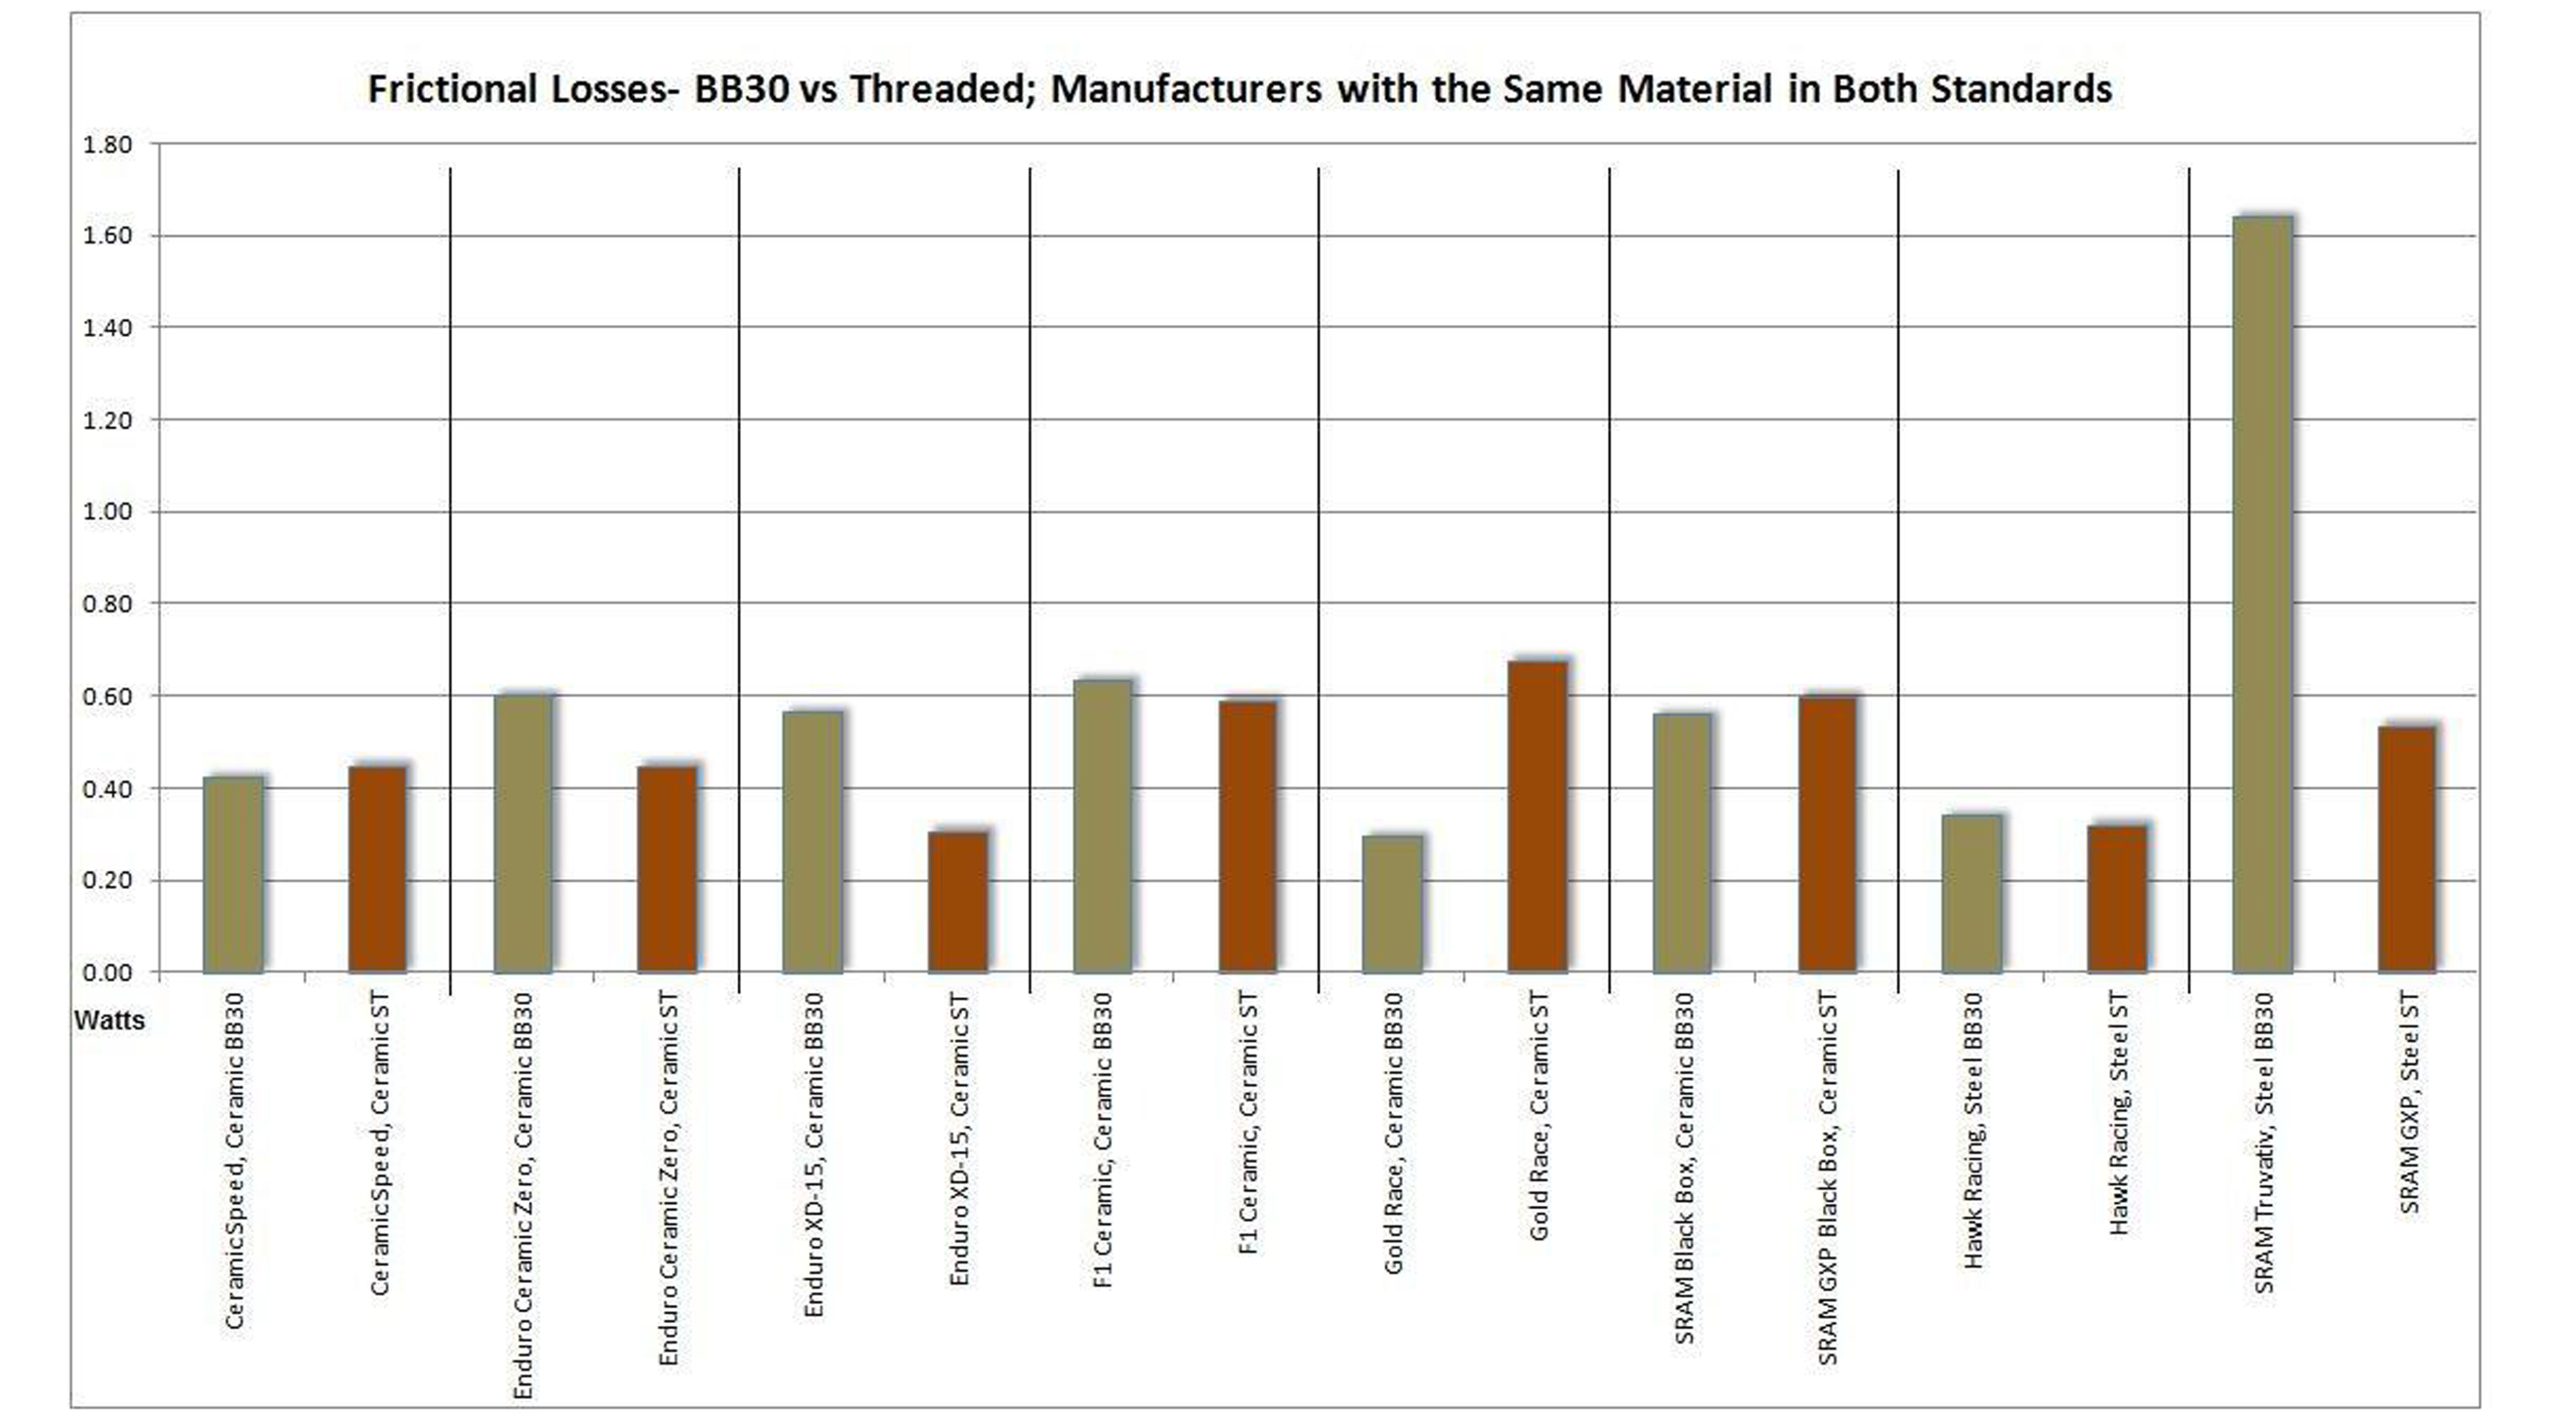
Comparing Standards; BB30 vs Standard Threaded (Holding Material/Manufacturer Constant):
The sample pool contained 16 samples (8 sets) of bottom bracket models that were from the same manufacturers, made with the same materials, in BB30 and Standard Threaded.
Comprehensive Results:
No statistically significant difference exists showing a general advantage or disadvantage of a standard type, namely BB30 vs. Standard Threaded, under similar loading conditions*. The median frictional losses of BB30 and Standard Threaded are 0.56 watts and .049 watts, respectively. It appears the frictional losses are heavily dependent on the manufacturer, quality, and design of the bottom bracket, rather than the standard itself.
Point to Note:
The bearing race center-point to bearing race center-point (effective width) of the Standard Threaded bottom brackets is greater than that of the BB30 and PF30 standard. This increased bottom bracket width decreases the cantilever moment on the crank spindle, effectively reducing the radial load on the bearings given the same pedal force.
* All samples in this test, regardless of standard, were tested with similar loading conditions. This was done intentionally to analyze different bottom bracket designs under the same loading conditions. The data presented in this report does not consider the effects of this cantilever difference between standards. Had they been considered, and factored into the results, it is estimated the values of the frictional losses of the Standard Threaded samples would decrease by approximately 5-10%.
The Bottom Line:
When identically loaded, no trend exists demonstrating the Standard Threaded type ofBottom Bracket is better or worse than the BB30 standard or the PF30 standard. When width andcantilever effects are considered, it is estimated the frictional losses of the Standard Threaded would beapproximately 5-10% lower than the equivalent BB30 or PF30, all else equal.
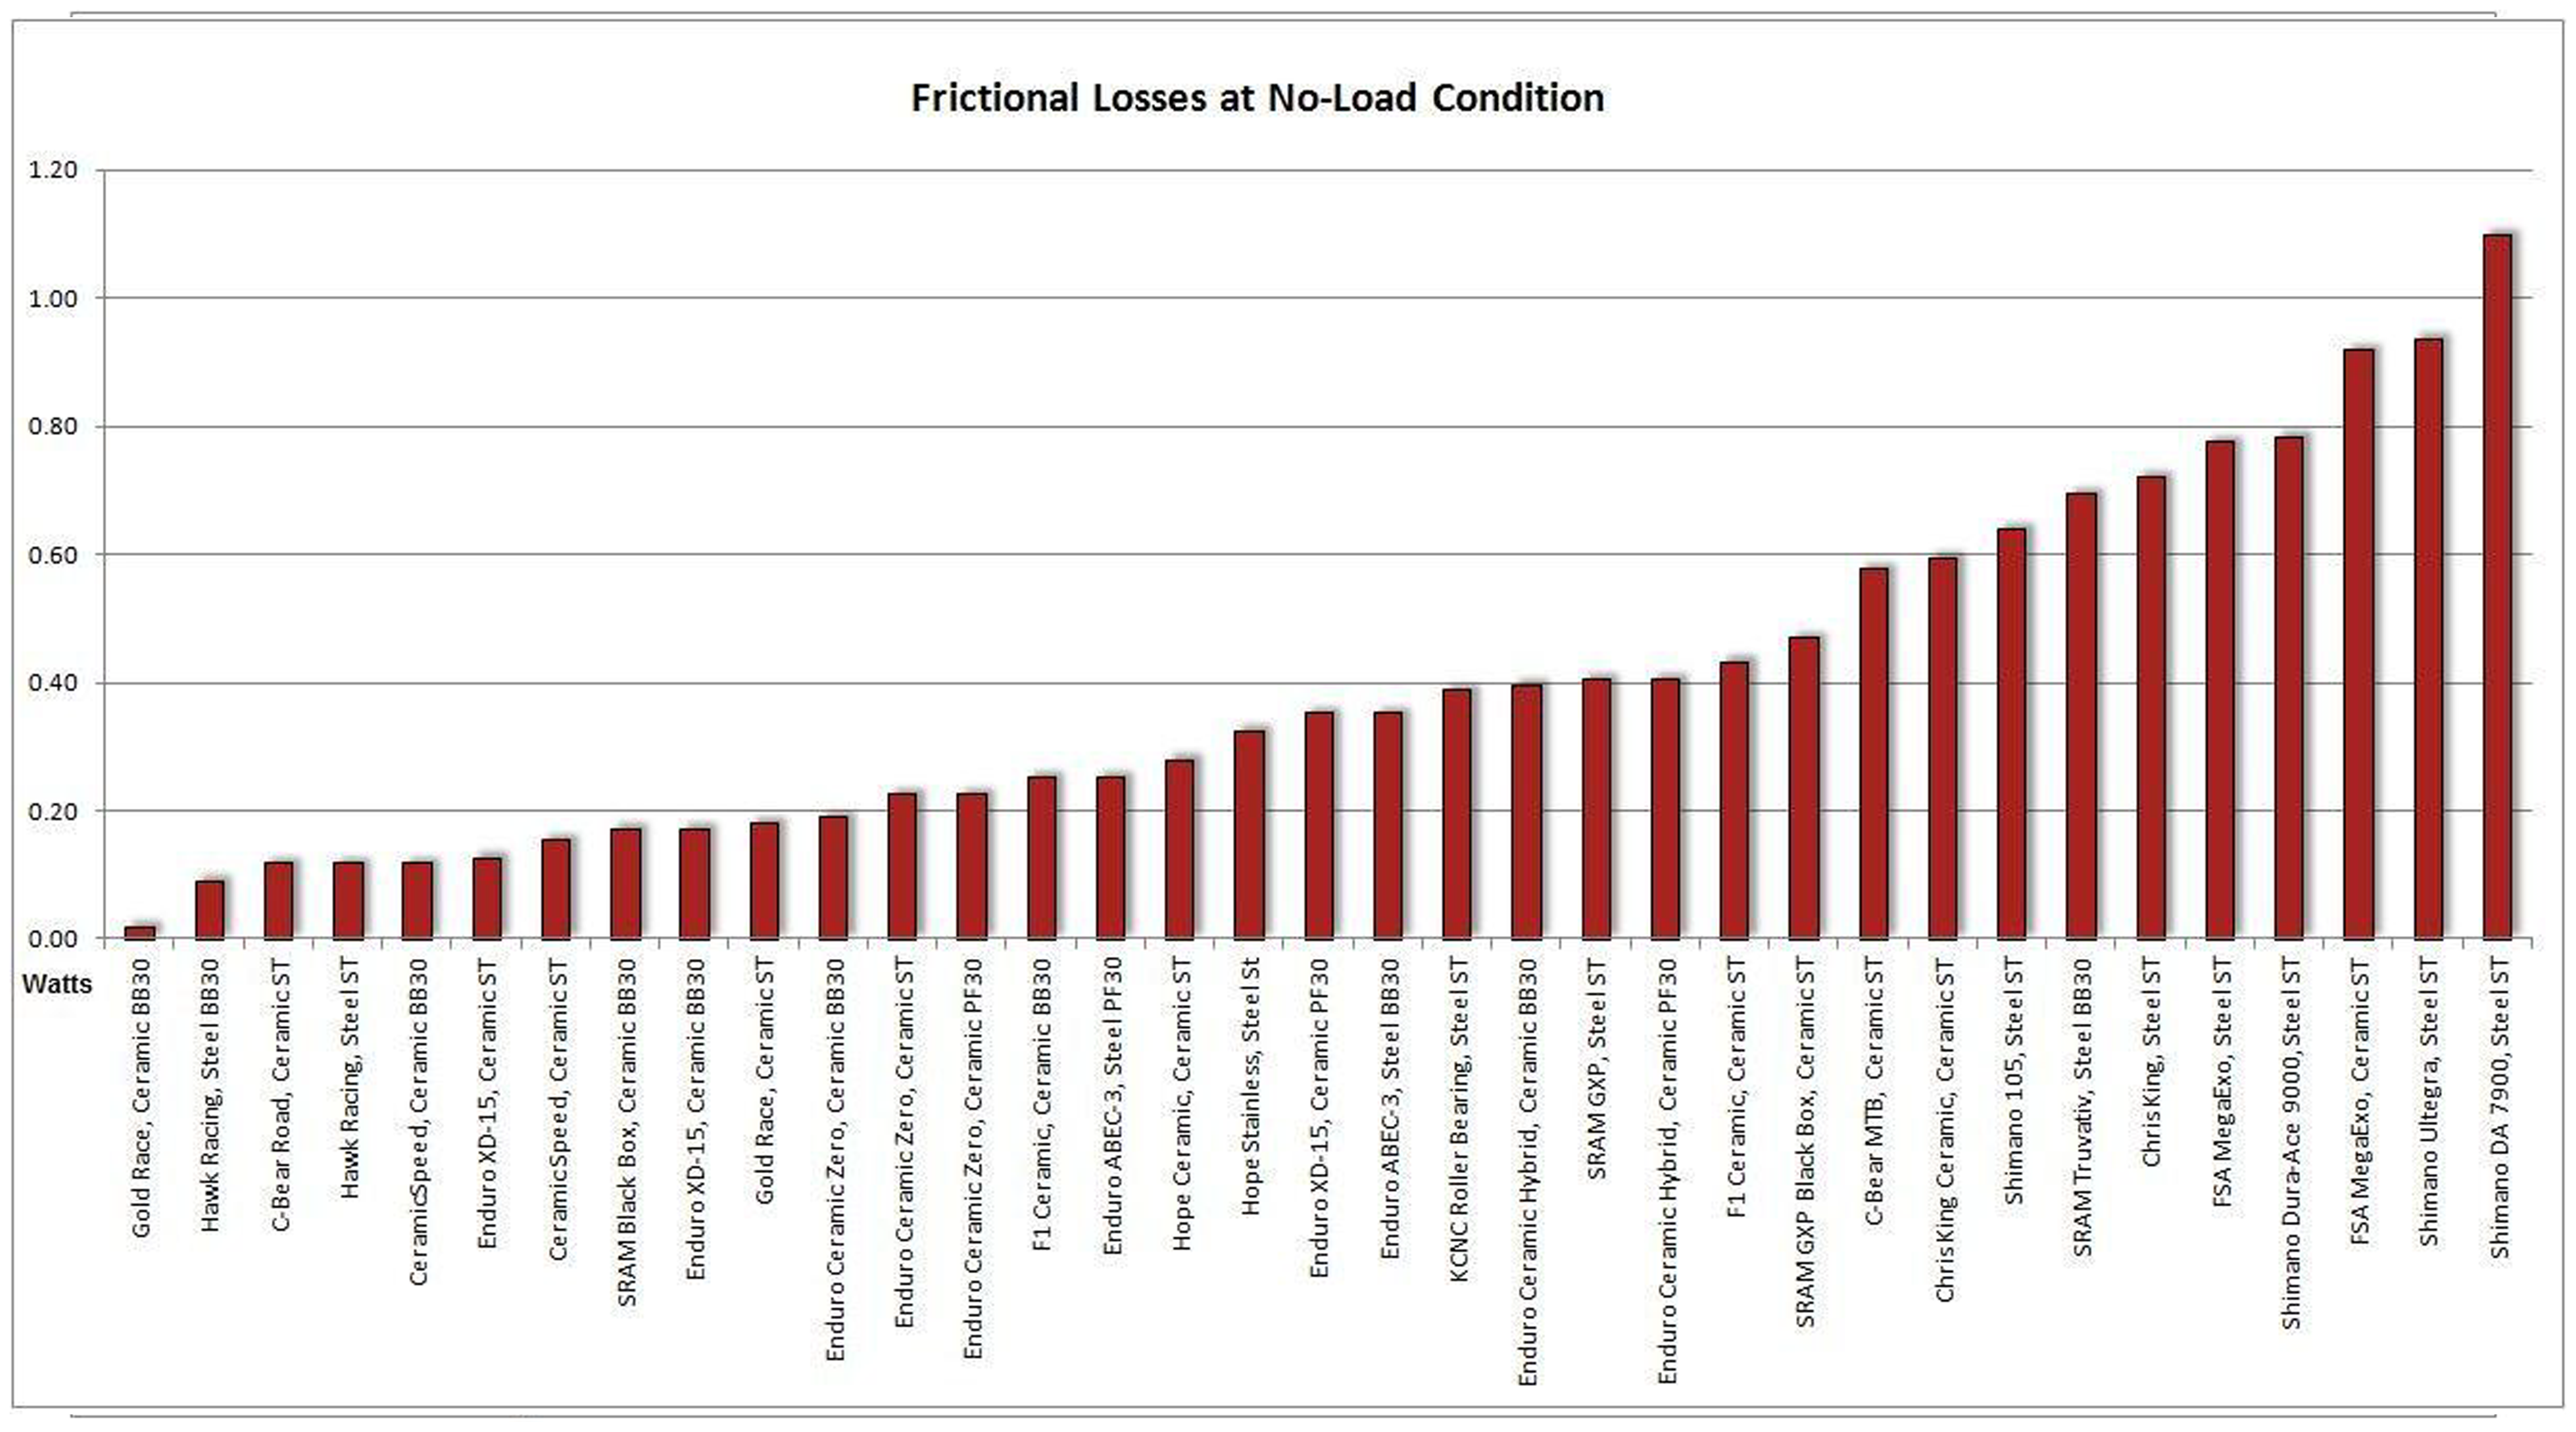
Comparing Bottom Brackets in Unloaded Condition:
The samples were tested with the load removed to determine the contribution of the seals and lubrication to the total frictional losses.
Why this test?
This test was performed to better understand the components of the frictional losses within each bottom bracket. The majority of the friction created by a bottom bracket can be attributed to three unique components. Each of these three unique factors can contribute a significant portion of friction to the bottom bracket as a whole.
- The friction created by the ball bearings rolling through the race (under load), by the slight deformation and sliding within the contact patch of ball-to-race interaction.
- The viscous drag created by the lubricant.
- The friction created by the seals sliding against the race (and rotating bearing covers if applicable in the bottom
bracket design).
Comprehensive Results:
The average unloaded friction is 0.40 watts, with a median value of 0.32 watts. The un-loaded friction is created, mostly, by the seals and lubricant (viscous drag). The ball/race interaction creates minimal friction in an unloaded condition, relative to the friction created by the seals and lubricant.
By comparing the average unloaded friction (0.40 watts) to the average loaded friction (0.77 watts), the comparison shows a larger portion of the total friction is created by the lubricant and seals (52%) than the actual ball/race friction (48%). The calculation [Total Loaded Friction] = [Unloaded Friction (contribution from seals and lube)] + [Loaded Friction (contribution from ball/race interaction)] was used.
This calculation was performed on the assumption that frictional losses created by the seals and lubricant are not entirely dependent on load, whereas the frictional losses created by the ball-race interaction are heavily dependent on load. Theoretically speaking, if the friction of an unloaded bottom bracket is measured and then subtracted from the total loaded friction, the resulting value provides friction created by the ball/race interaction under load.
Realistically, this method of frictional loss segregation is not absolute. Yet, it provides a general indicator of the contributions of each friction-producing component.
Important Notes:
This test evaluates only the efficiency of a bottom bracket. It does not take into account other important features such as the design of the seals and factory lubricant which will affect longevity and durability.
A thicker viscosity grease can provide longevity, but at the expense of heavy viscous drag. Conversely, a lighter viscosity oil minimizes viscous drag, but at the possible expense of bearing longevity and increased maintenance intervals.
Designers strive to achieve a balance of maximizing protection from the elements based on the intended use of the product vs. minimizing seal drag for high efficiency. The goal is to have a bottom bracket that is durable for the intended application yet efficient.
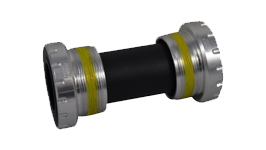
The Gold Race BB30 bottom bracket is an example of a design approach taken to achieve maximum efficiency. The seal inner diameter does not actually come into contact with the inner race. A gap is visible. This gap (and subsequently no friction due to the non-contact seals) is likely why the Gold Race exhibits the lowest unloaded frictional losses (along with use of a light oil rather than grease). However, this design can more readily allow contaminants to enter the bearings if used in dirty conditions. In fact, the Gold Race manufacturer instructions recommend their product for
track and clean road racing use only.
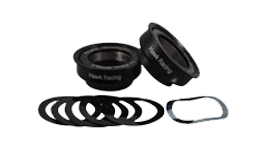
Another example of the effects of seals and lubricants can be seen in the C-Bear products. According to the manufacturer, the internal bearings of both the Road bottom bracket and MTB bottom bracket are identical. However, the MTB version incorporates more robust seals and heavier weight grease to provide longevity and durability in harsher conditions. Accordingly, the frictional losses of the MTB version are 0.54 watts greater than the Road version.
* All samples in this test, regardless of standard, were tested with similar loading conditions. This was done intentionally to analyze different bottom bracket designs under the same loading conditions. The data presented in this report does not consider the effects of this cantilever difference between standards. Had they been considered, and factored into the results, it is estimated the values of the frictional losses of the Standard Threaded samples would decrease by approximately 5-10%.
The Bottom Line:
Seals, lubricant, and ball/race interaction each play a part in the frictional losses of a bottom bracket. Per the calculations, the friction contribution of the seals and lubricant is slightly larger than that of the ball/race interaction, when looking at the average of all samples. The seal design and factory-provided lubricant of an individual bottom can vary greatly based on intended use and the need for durability, longevity, and/or performance. When choosing a bottom bracket, it is important to consider the intended use, maintenance requirements, and construction of the specific bottom bracket to ensure it fitsthe specific cycling application.
Theoretical Losses of the Bearings Alone:
Based on the calculation described above, the losses of the bearing due to ball/race interaction (under load) can be determined. The values in this graph represent the frictional losses in each Bottom Bracket solely due to the ball/race interaction, with no contributions from the seals or lubricant. The data was calculated by subtracting the un-loaded friction from the loaded friction. As mentioned above, this is a general indicator and not absolute. The information in this graph is more of a novelty than of practical use. Removal of seals and lubricant is not recommended.
Data
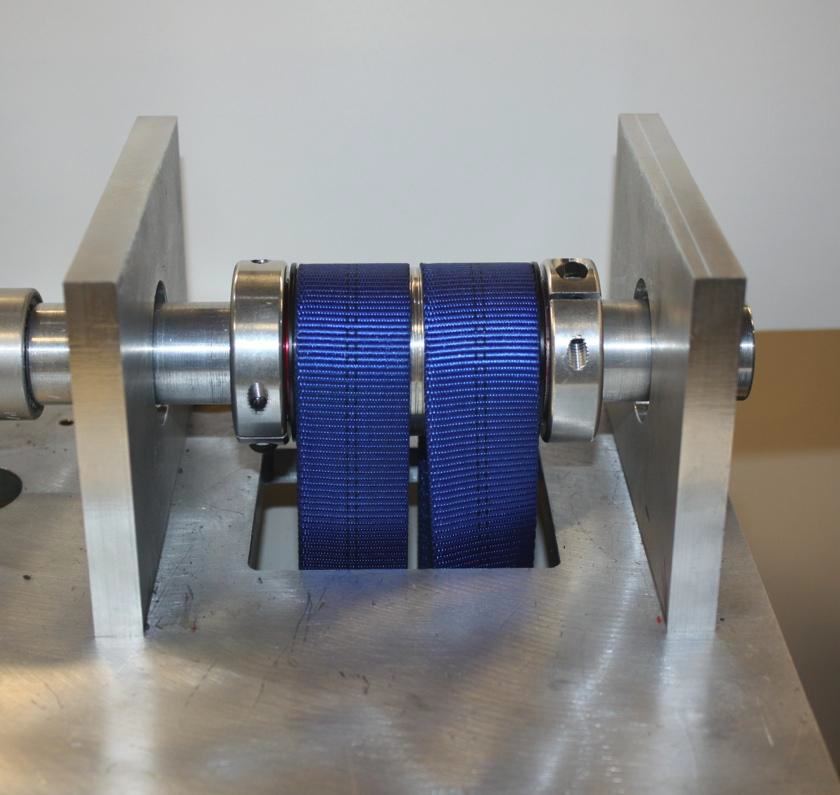
Bottom Bracket Efficiency Test Equipment
A relatively simple design was utilized to test the efficiency of bottom brackets. The design comprised a set of ceramic fixture bearings, which support a shaft, which in turn support the bottom bracket installed in a shell with load applied to the shell. As the shaft turns, total friction of the system is measured, which includes the bottom bracket bearings and the fixture bearings. The fixture bearing losses (equipment losses) are removed from the measurement, resulting in a frictional loss value of the bottom bracket under test.
The shells in which the bottom brackets were installed were industry standard BB30, Press Fit 30 (PF30), and Standard Threaded shells. These shells are the same bottom bracket shells used by frame manufacturers for frame construction, and were procured from frame component suppliers. This mechanism provides a high level of reliability both in the production of cialis and viagra tablets for ED. A load was applied to the shell through the use of wide nylon straps running across the top of the shell, to achieve an evenly distributed loading across the shell, as well as to provide equal loading on each of the right and left bearings. A shaft with its outer diameter (OD) matching the bottom bracket inner diameter (ID) was inserted into the bottom bracket (acting as the crank spindle). The shaft, bottom brackets, and load straps are, in turn in supported by two ceramic fixture bearings. Clamps were utilized to fix the bottom bracket relative to the shaft and provide a light pre-load to the bottom bracket. Another set of clamps were utilized outside of the fixture bearings to laterally fix the shaft to the fixture bearings. These clamps kept the shaft and bottom bracket from sliding horizontally during lateral loading conditions.
The shell (with the bottom bracket installed internally), straps, and load remain stationary as the shaft rotates inside of the shell at 95 RPM. The rotational torque sensor, located in-line between the drive motor and shaft, measures the total friction (as torque) created by the two bearings in the bottom bracket, plus the two fixture bearings.
To maintain accuracy and consistency, the same fixture bearings were utilized throughout the entire test. Since different shaft OD’s were required to mate to the different ID BB standards, adapters were fabricated for each different-sized shaft to allow the shafts with different OD’s to interface with the same fixture bearings which had a fixed ID.
The frictional losses of the fixture bearings (for both radial and lateral loading conditions) are a known quantity from pre-test calibration. The fixture bearing frictional losses are subtracted from the total measured frictional losses, resulting in the frictional losses of the bottom bracket under test.
The precision of the Bottom Bracket Efficiency Tester is +/- 0.01 watts.
Full Procedure
A bottom bracket sample was installed in the respective shell (BB30, PF30, or Standard Threaded) and placed in the equipment.
A light preload was applied to the bottom bracket via the outboard clamps, to simulate finger tightening of the crank adjustment nut. All break-in and testing was performed at 95 RPM.
Each bottom bracket was broken-in for one hour, subjected to a 114lb pure radial load. The objective of this period is to break-in the bearing lubricant and seals.
After the break-in period, a lateral load of 20lbs was applied to the right side (in addition to the 114lbs radial already applied to the bottom bracket from the break-in period), and a measurement was recorded after 3 minutes. The 20 lbs lateral load was removed from the right side and applied to the left side, and a second measurement was recorded after 3 minutes. These are the ‘Right Lateral’ and ‘Left Lateral’ measurements.
The equipment averaging was set to 15 seconds. I.e., all measurements are an average of data over a 15 second window.
After the left lateral measurement was recorded, the lateral load was removed, leaving only the pure 114lb radial load. A measurement was then recorded after 3 minutes. This was the “Pure Radial” measurement. The radial load was then removed and the bottom bracket subsequently fixed to prohibit free spinning. The bottom bracket was now unloaded. A measurement was recorded. This measurement was the “unloaded” measurement.
The frictional losses of the equipment fixture bearings (equipment losses) for each of the four loading conditions were determined during initial equipment set up and calibration. These equipment losses were removed from raw measurements. Thus, the resultant data presented in this report is solely the frictional loss of the bottom bracket sample under test.
Exceptions to the defined protocol:
The two F1 ceramic bottom brackets were each broken in for 4 hours, per the manufacturer’s instructions. The preload on the three Enduro XD-15 bottom brackets (angular contact bearings) was set to 20lbs per the manufacturer’s recommendation.
Loading Calculations
Bottom bracket bearings can be subjected to a wide range of loading conditions during typical riding. Loads on the bearings can be as little as a few pounds during easy pedaling, to over 400 lbs during heavy acceleration, when full rider weight is applied at the pedal and the chain is in the small front ring (chain tension is greater when using the small ring. A larger reactive force is seen by the bottom bracket).
The load applied for this test (pure radial loading condition) was 114 lbs. This load is the approximate average load the bottom brackets would see during steady-state riding at 250 watts of rider output. The assumptions for this calculation are as follows: 175mm crank length, the chain is in the large ring, the large ring is 53T, the rider is pedaling at 95 RPM, with a steady state power output of 250W. The calculations take into consideration the loading due to the rider pedal forces, the peak loading during the pedaling downstroke, the reactive force due to the tensioned chain, plus the cantilever effects (the point of load for the pedals and chain ring are outside of the respective centerlines of the bearings, creating a moment).
Drive-side and non-drive-side bearings are subjected to different loads at any given point of the pedal stroke, with the drive-side bearing experiencing higher average loads than the non-drive-side bearing due to the reactive force of the chain ring being on the drive side. The 114 lbs used in this test is the combined average of loads on both bearings equally. The lateral loading condition was an addition of 20 lbs on either side of the bearing to simulate off vertical loading conditions. This lateral loading approximated a rider in a 10° off-vertical orientation, similar to the orientation experienced while pedaling out of the saddle.
Find the right bracket for your bike.
We make most standards of bottom bracket. Click the button below to check out our selection.